The Big Picture
A nice overview of the current scoring rules for singles figure skating can be found here.
The gist is that each skater makes two performances: a “short programme” lasting a bit under 3 minutes and a “free skate” lasting just over 4 minutes. During these programmes the skater attempts a series of “technical elements” (i.e. jumps, spins and sequences). A panel of judges numerically assesses both the individual elements and various aspects of the overall performance, and these assessments are aggregated into an overall score for the programme. The skater’s final score is the sum of their two programme scores.
At least to start with, the analysis here is going to focus on one aspect of the scoring system: the “grade of execution” scores that the judges assign to each element. These are whole numbers between -5 and 5, representing how well the judge thinks that the skater pulled off the element. If the skater falls on a jump, the jump’s grade of execution is -5; if they complete the jump but don’t land well the grade might be -1; if they enter smoothly and land perfectly the jump would probably score 4 or 5.
The aim will be to make a statistical model that describes and predicts these numbers. In other words, when a particular skater, say Yuzuru Hanyu, attempts a certain jump, this quad loop for example
we want to know how likely it is that his scorecard will look like this:
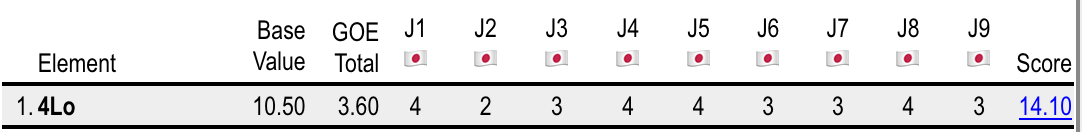
With such a model it might be possible to answer some of these tantalising questions:
- Could someone game the system by choosing high scoring but easy elements?
- What are the chances that, if two skaters attempt the same programme, the best skater will get the higher score?
- How good is Yuzuru, really?
There are lots of ways to narrow this idea down and lots of details to work out. Should we measure all elements or just jumps, or just quad jumps? Should we include qualitative judgements - for example about whether a jump was over or under rotated - as well as the quantitative -5 to +5 scores? What measurement model should we use? Should we allow skaters to change how good they are over time?
In my opinion these questions are best left until later. Now it’s time to fetch and format some data, then dive into the tangled cycle of model formulation, analysis and testing that characterises most projects like this. With luck we might end up doing something like this:
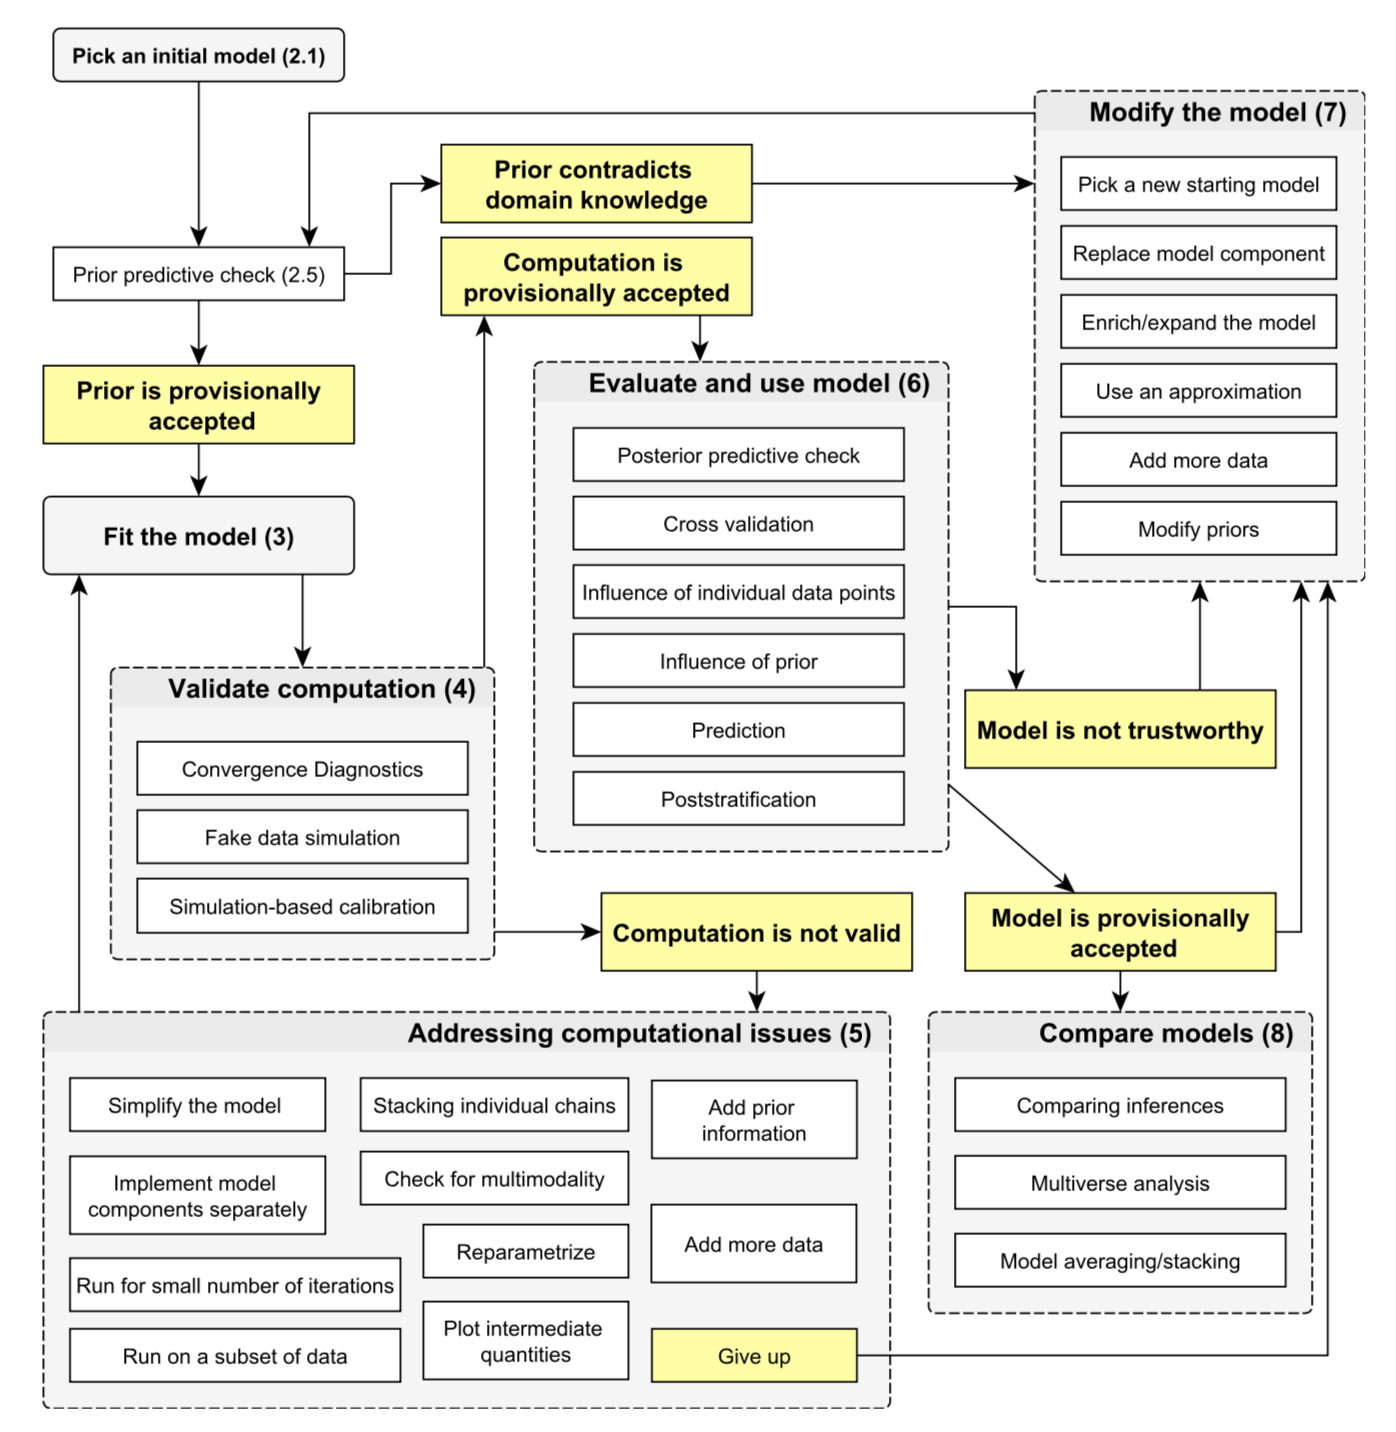
Bayesian workflow, as visualised in Gelman, A., Vehtari, A., Simpson, D., Margossian, C. C., Carpenter, B., Yao, Y., Kennedy, L., Gabry, J., Bürkner, P.C., Modràk, M. (2020). Bayesian Workflow. arXiv:2011.01808
The next post will start this process by setting out how to fetch and format the data we need from skatingscores using some python libaries.